

Constituent Intelligence Hub
Constituent Intelligence Hub turns your Virtuous fundraising data into clear insight and prioritized action. It reveals where revenue is growing, where it’s at risk, and which opportunities matter most—so your team can focus on the moves that drive predictable growth.
About
Constituent Intelligence Hub (CI Hub) integrates with Virtuous to help nonprofits uncover hidden revenue opportunities, identify risk, and take action using their own donar data. CI Hub analyzes constituent behavior across fundraising, engagement, and giving patterns to surface insights that drive smarter decisions and more predictable growth.
By combining waterfall analysis, insight reports, and action cards, CI Hub shows teams what’s happening, why it’s happening, and exactly what to do next—all in one place.
Integration Diagrams
Data
Gifts, Contacts, Segments, Engagement & Interaction Data, Donor Data
Gifts, Contacts, Segments, Engagement & Interaction Data, Donor Data

Data
Insight Reports, Action Cards, Risk & Opportunity Waterfall, Priority Segments, Campaign Recommendations, AI Insights Agent
Insight Reports, Action Cards, Risk & Opportunity Waterfall, Priority Segments, Campaign Recommendations, AI Insights Agent
Features
Waterfall Analysis
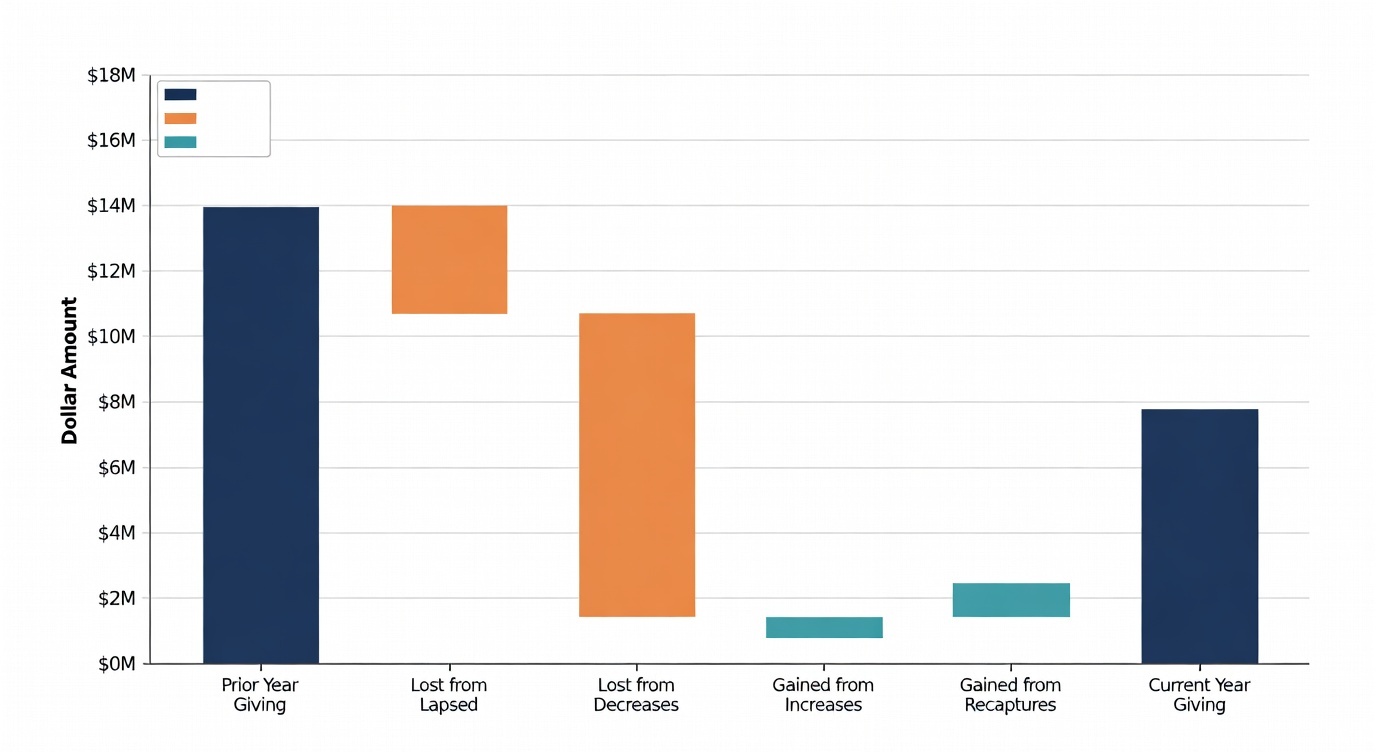
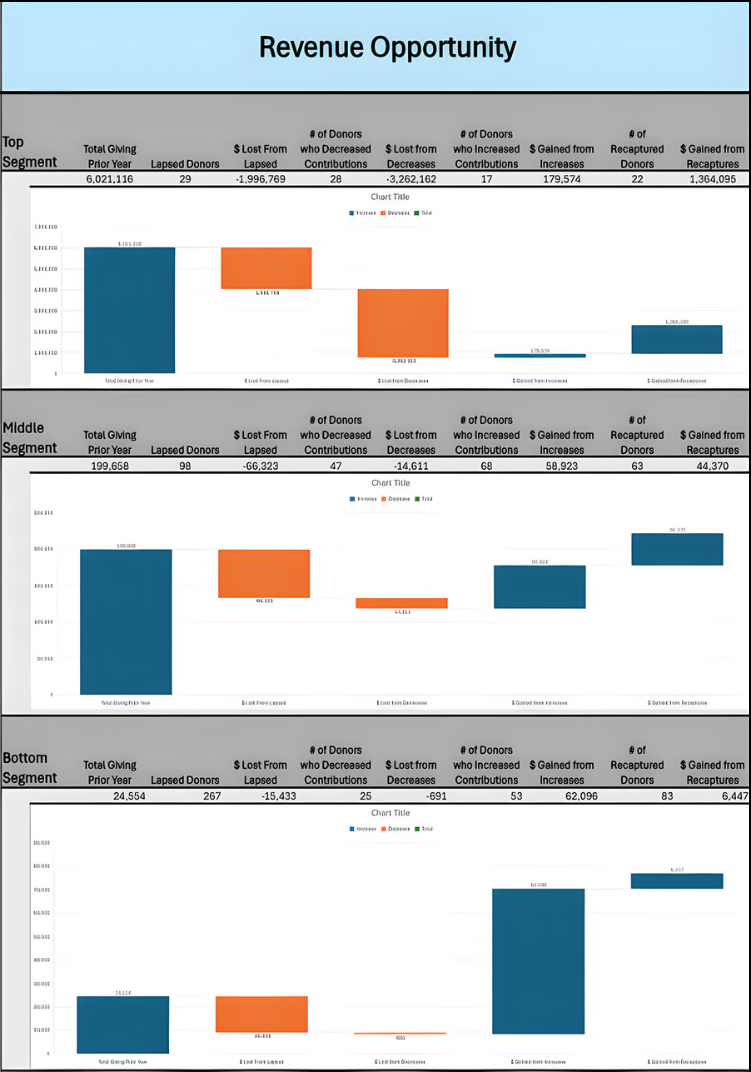
Reveal where revenue is growing, stagnating, or leaking across your donor file. CI Hub breaks down performance by acquisition, retention, upgrade, and reactivation so teams can pinpoint what’s driving results—and what’s holding them back.
Opportunity Identification
Automatically surface your highest-value fundraising opportunities, including donors ready to upgrade, re-engage, or deepen commitment—before those opportunities are missed.
Risk Detection
Identify early warning signs of donor attrition and revenue decline. CI Hub highlights at-risk donors and segments so teams can intervene proactively.
Insight Waterfall Reports
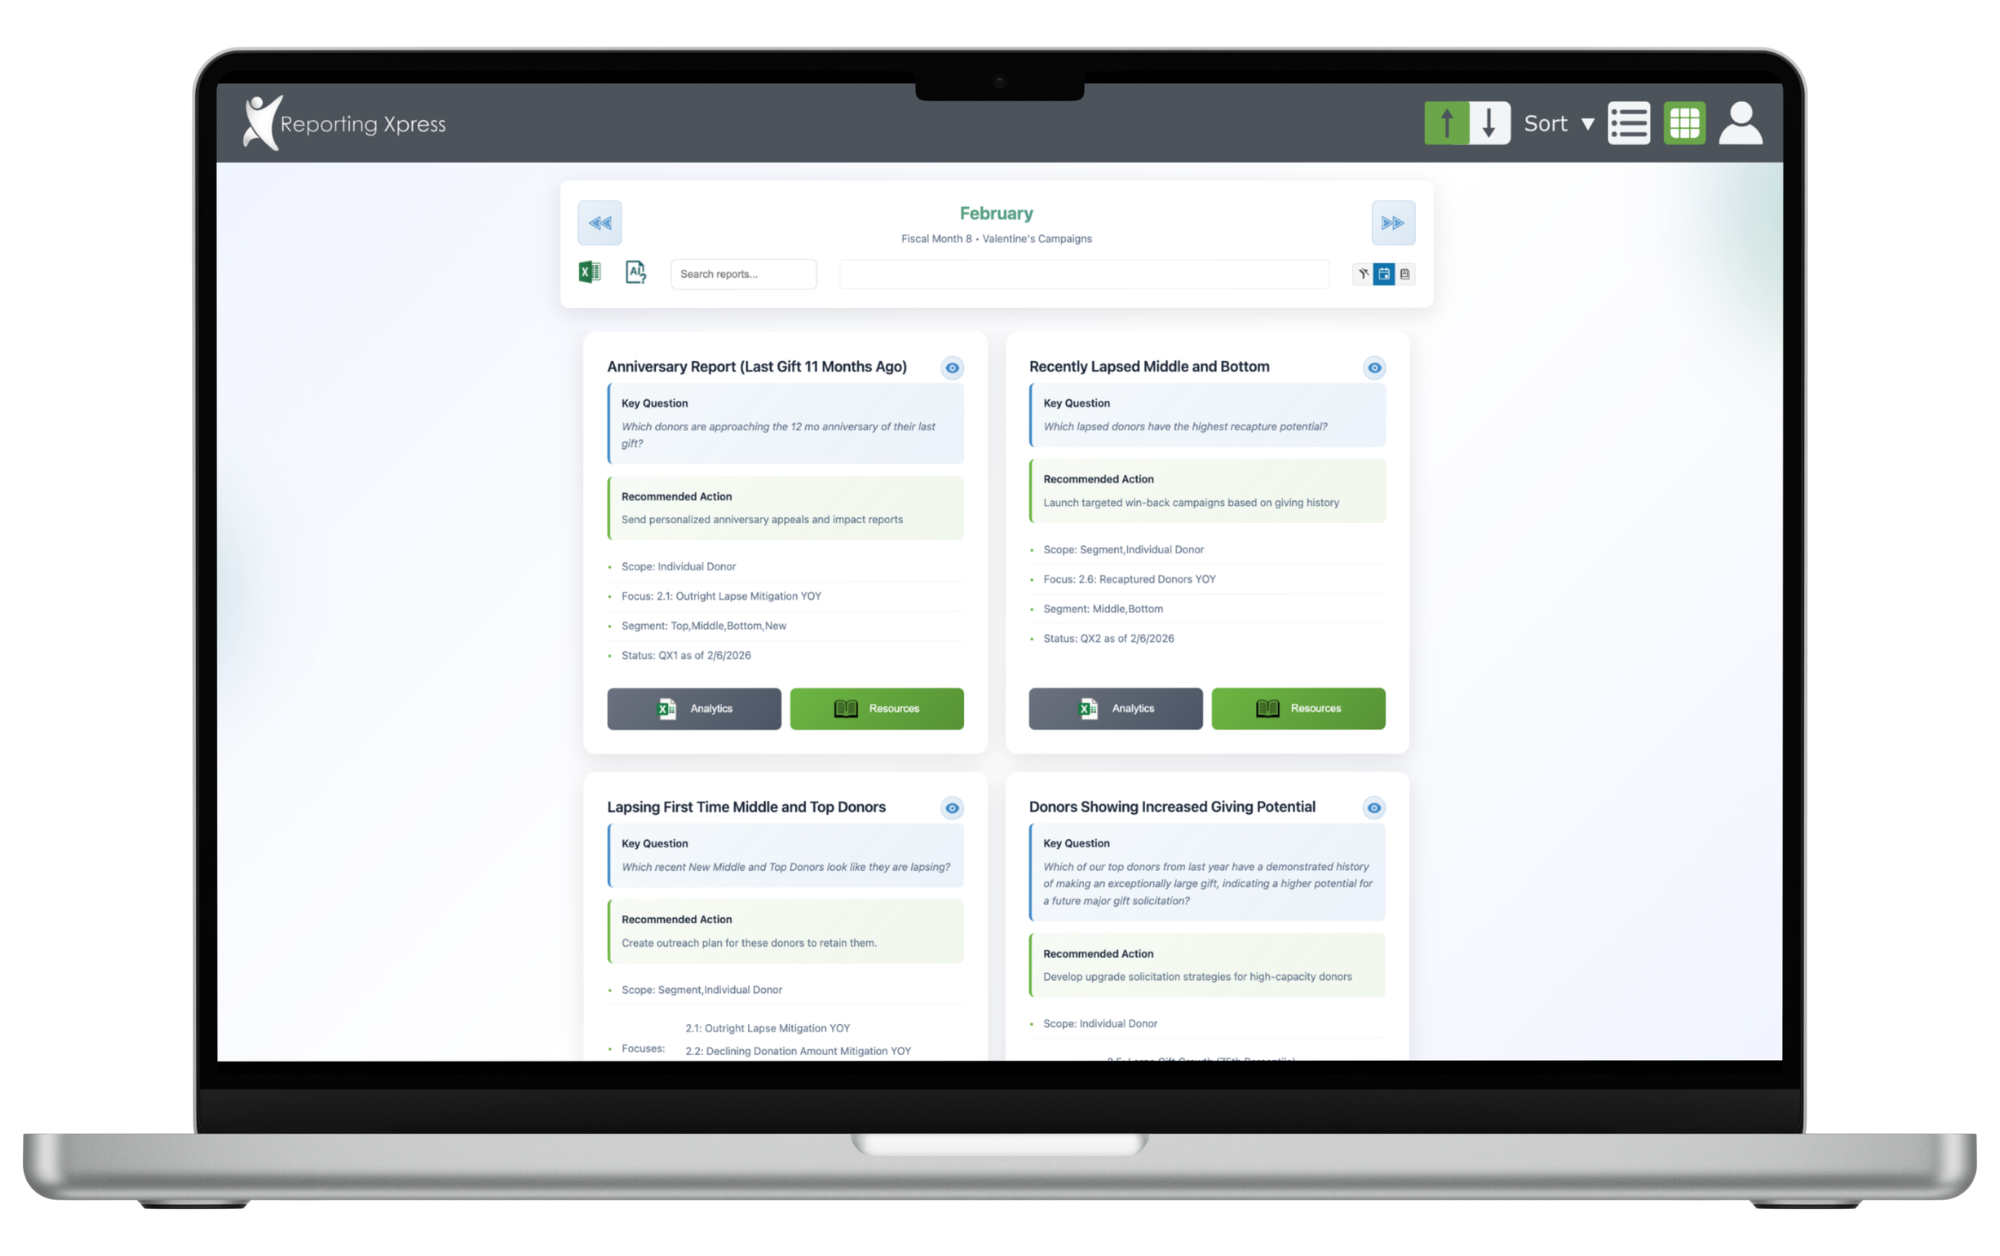
Turn complex data into clear, executive-ready insights. CI Hub delivers plain-language waterfall reports that explain performance trends and what actions will have the biggest impact.
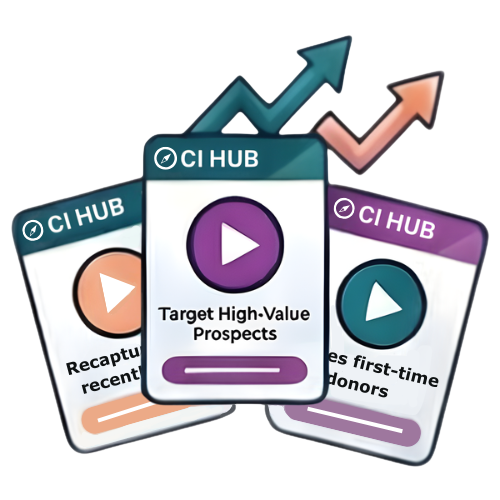
Action Cards
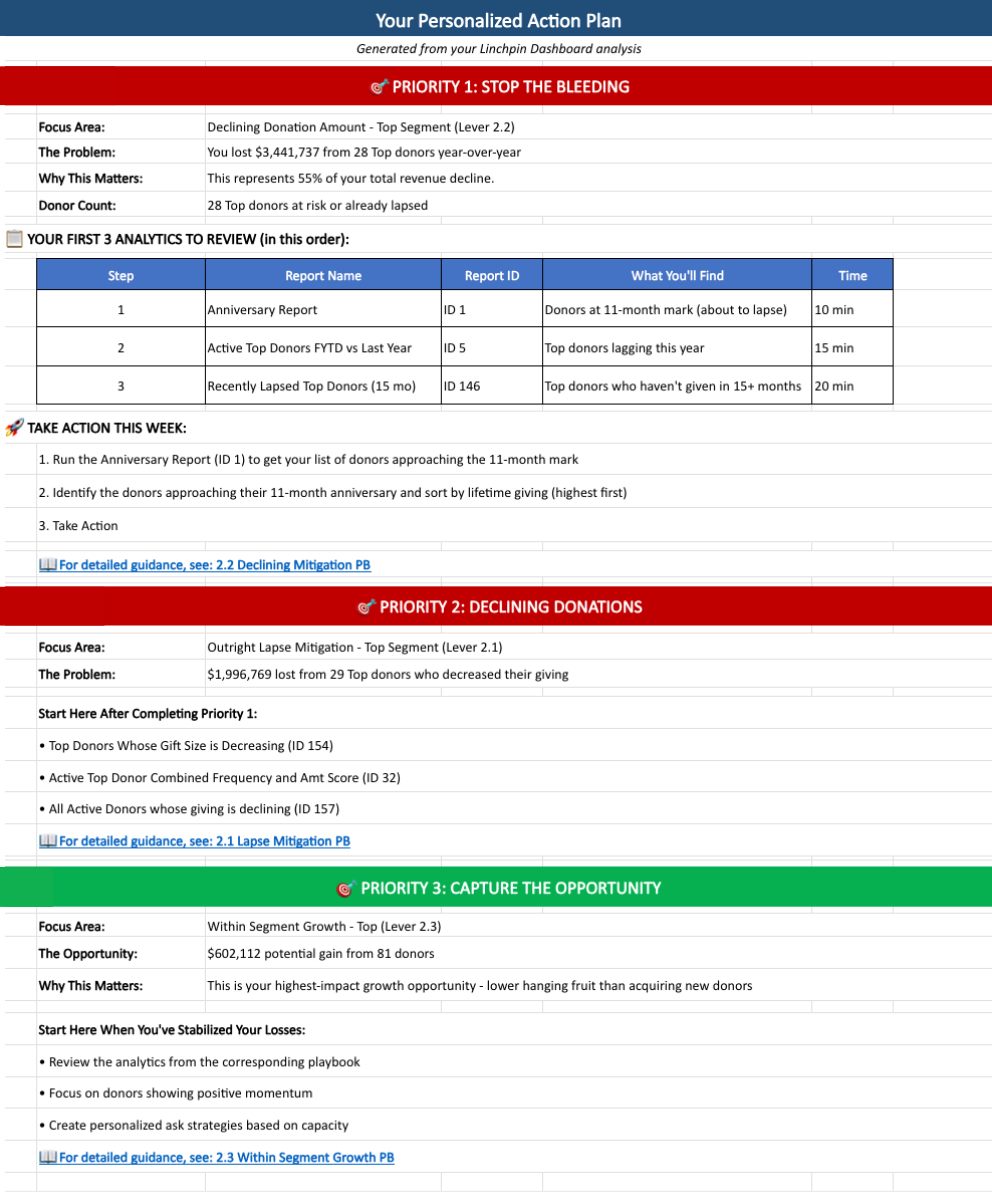
Move from insight to execution. Action Cards translate data into prioritized, role-specific next steps your team can act on immediately—without needing an analyst.

AI Insights Agents
Ask natural language questions of the CI AI Agent and go deeper into your data than ever before.
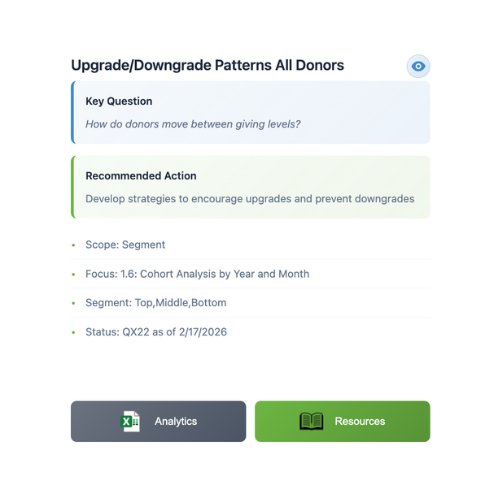
Segment Intelligence
Build smarter segments based on behavior, momentum, and likelihood to give—not just static attributes. CI Hub helps teams focus effort where it matters most.

Leadership Dashboards
Give executives and board members a clear view of fundraising health, opportunities, and risks—that drive strategic alignment.

Data Confidence & Alignment
Create a shared source of truth across fundraising, finance, and leadership. CI Hub ensures teams are aligned around the same metrics, insights, and priorities.
Images
Resources
FAQ
Most traditional fundraising reports are reactive and historical; they tell you "What happened" (e.g., how much was raised last month). Constituent Intelligence is proactive and predictive; it focuses on "what should I do next?" CI Hub transforms raw data into dynamic insights about relationship trajectories, helping you influence what happens in the future rather than just observing the past.
The sources highlight a "Fundraising Data Paradox": nonprofits are often data-rich but insight-poor. You may have years of donor records, but no clear answer on what to do about them today. CI Hub uses over 150 prebuilt analytics to eliminate the need for manual data-crunching, giving your team specific target lists—such as donors at risk of lapsing or those ready for an upgrade—so you can spend more time building relationships and less time building queries and crunching data manually.
CI is based on the principle that donors exhibit predictable giving patterns. By analyzing the Recency, Frequency, and Monetary (RFM) values of your supporters, the Hub identifies "natural groupings." For example, if a group of 100 donors has historically given recently, frequently, and generously, the Hub warns you if an individual in that group’s specific behavior starts to deviate so you can take action.
No. One of the primary goals of CI Hub is to "democratize data science." It puts the power of complex statistical methodologies (like K-Means clustering or Markov chain modeling) behind a simple interface. All of the analytics are prebuilt and populated with your data. Additionally, every analytic includes a resource page that explains what the metric means and how to use it, making it accessible even to team members new to fundraising.
Not at all. CI Hub provides specific guidance that can be applied across the entire development department. Examples:
- Annual Fund Managers receive optimal solicitation frequencies and timing to avoid over-soliciting loyal givers.
- Leadership/Directors gain high-level strategic insights into revenue concentration and organizational health.
- Prospect managers can see which months are optimal for attracting donors with the highest lifetime value.
- Anyone involved in stewardship can identify early warning signs of long-term donors whose support may be waning.
By the time a traditional report shows a donor has lapsed, the relationship has already cooled. CI Hub uses Attrition Risk Scoring to detect "silent" warning signs—like a decline in gift frequency or amounts or an increase in time between gifts—before the lapse occurs, allowing for a timely intervention.
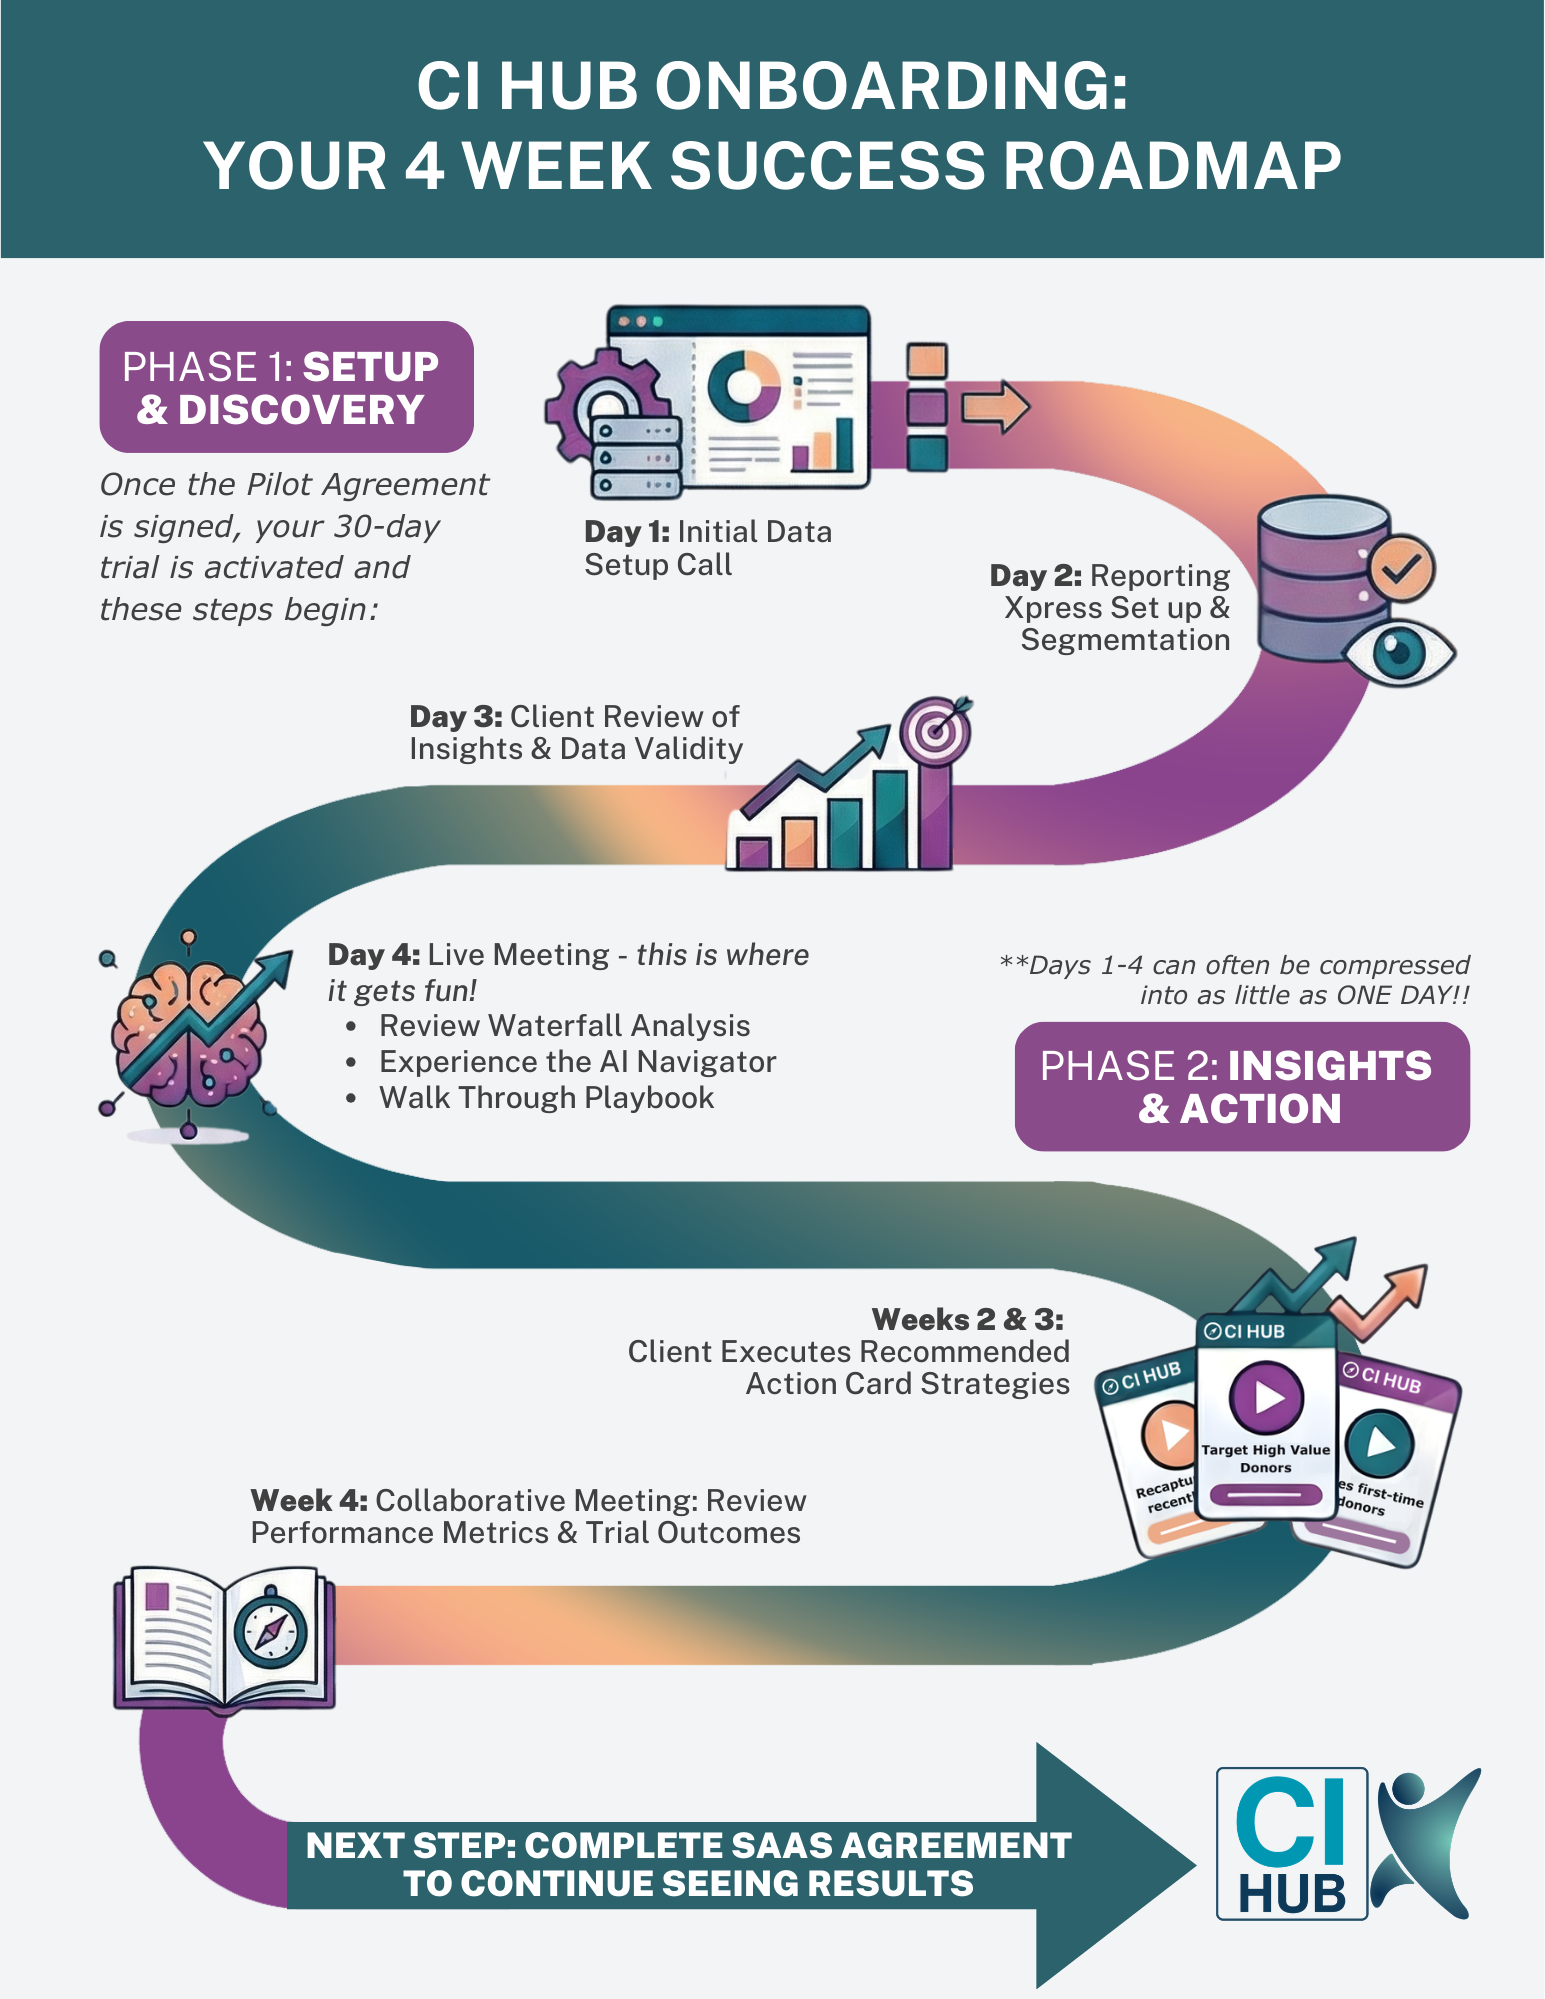
The system integrates seamlessly with platforms like Raiser’s Edge NXT via API. Implementation typically takes less than one day and requires less than an hour of your staff’s time, with intelligence updates occurring automatically every day.
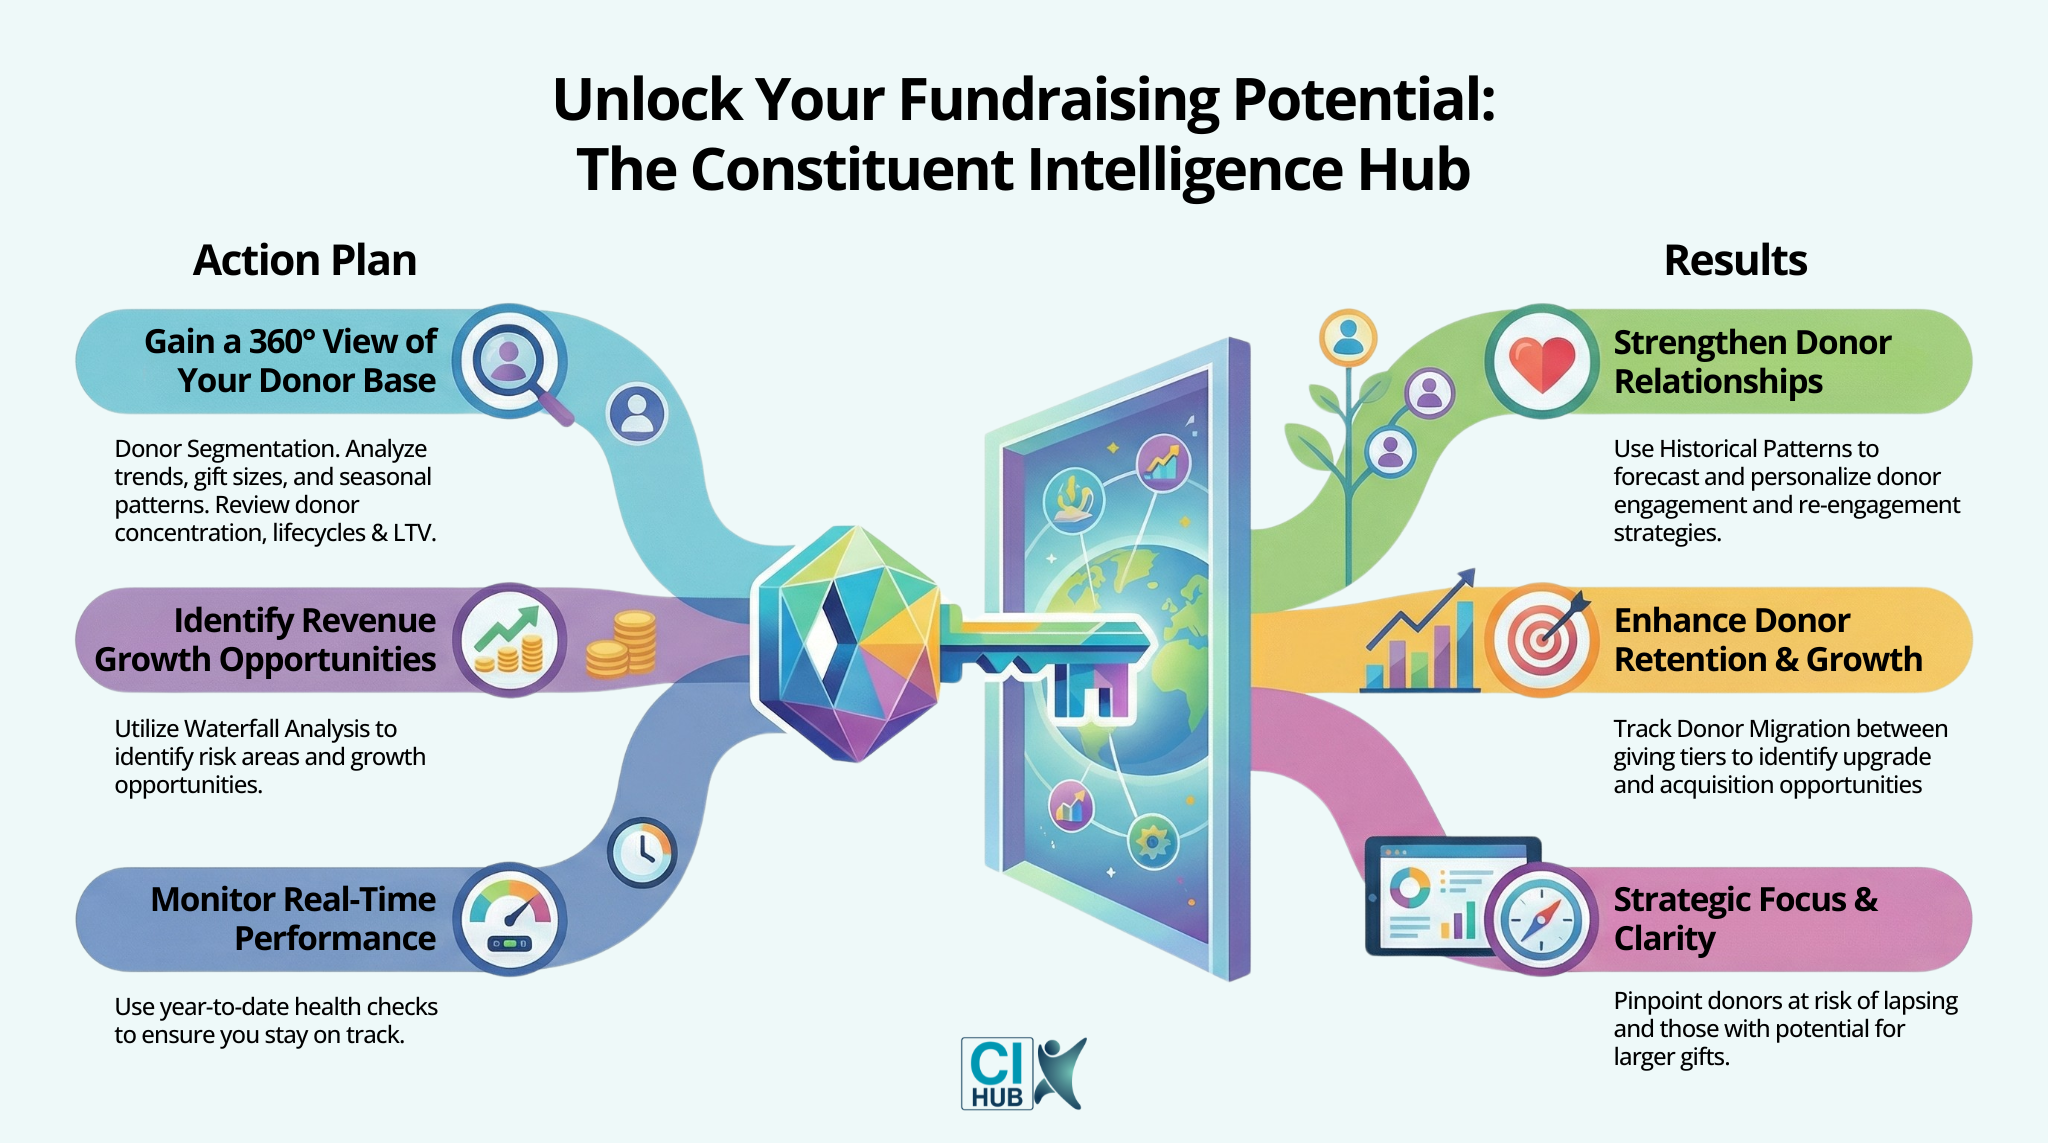
Analysis Analytics establishes the foundational truth of your fundraising program. Before you can optimize your strategy ( Pillar 02: Levers & Action), you must first understand the current reality. This suite of 150+ analytics provides a 360° view of your donor base, identifying who your donors are, how they have historically behaved, and where your revenue is actually coming from.
Single-year comparisons can be misleading due to temporary anomalies like a major one-time gift or campaign timing. CI Hub provides long term views on donor counts, gift sizes, and revenue (Analytics QX89, QX90, QX91) to help you distinguish between random fluctuations and meaningful long-term shifts in donor loyalty.
Sophisticated teams move beyond organizational totals to look at three levels:
- Organizational: Macro performance (overall revenue/donor count).
- Segment: Performance within categories (e.g., Active Top, Active Middle).
- Individual: Behavioral patterns of your most financially significant supporters. This helps you identify if your growth is Volume-Driven (adding more donors) or Value-Driven (relying on fewer, larger gifts).
Traditional fundraising followed the 80/20 rule (20% of donors give 80% of revenue). However, recent surveys indicate a shift toward a 90/10 or even 95/5 reality due to wealth inequality. CI Hub’s Pareto Analysis (Analytics QX40, QX42) identifies your "vital few" donors, revealing your organization's dependency risk and how much revenue you would lose if just a handful of relationships cooled.
Averages are easily skewed by a few very large or very small gifts. The sources state that Gift Size Distribution Analysis (Analytics QX92, QX93, QX94) looks at:
- 25th Percentile (P25): The "entry point" donors.
- 50th Percentile (P50/Median): The "typical" donor.
- 75th Percentile (P75): High performers within a segment.
By comparing these, you can find upgrade pathways—for example, when your "Bottom" segment's top performers (P75) are already giving at a level that overlaps with your "Middle" segment's entry point (P25).
A Cohort is a group of donors who gave their first gift in the same period (e.g., the "2022 Cohort"). Celebrating "500 new donors" is a mistake if those donors are low-quality. Cohort Analysis tracks these groups over time to see which acquisition channels or months produce sustainable relationships versus expensive "one-time surprises."
Donor Tenure measures consecutive and cumulative years of giving, while LTV calculates the long-term economic value of a relationship. Use this data to build business cases for the board. For example, if you can prove that retaining a mid-level donor generates $4,100 in LTV over five years, you can justify spending several hundred dollars on their stewardship today.
This is a YOY Revenue Map that visualizes the flow of money. It breaks down total revenue into its core components: New (acquisition), Retained (loyalty), and Recaptured (win-back). This allows you to see precisely which part of your "fundraising engine" is driving performance, and which parts are underperforming. Retained donors are further segmented by whether they are maintaining their annual giving levels or reducing or increasing them.
Pricing
Constituent Intelligence (CI) Hub
$495/month (billed annually at $5,940/year)
The CI Hub is a proactive intelligence system that shifts your development team from a reactive cycle of manual data crunching to daily, actionable insights. By seamlessly integrating with your database, it provides over 150 prebuilt advanced analytics based on RFM (Recency, Frequency, Monetary) theory to identify donors at risk of lapsing, first-time donors needing nurture, and supporters ready for upgrade conversations. Every insight includes role-tailored recommendations—from cultivation timelines for Major Gift Officers to optimal solicitation frequencies for Annual Giving Managers—ensuring your team knows exactly what to do next to maximize ROI. Implementation is fast and painless, typically completed in less than 48 hours with less than one hour of staff time required
- ◦ Access to a roadmap for fundraising performance optimization in one easy-to-use hub.
- ◦ Real-time data connection and automated daily updates.
- ◦ Opportunity to see donor-specific recommendations and early warning systems in action.
- ◦ Complete onboarding and support to help your team transition from reactive reports to proactive intelligence
* The pricing here is for display purposes only. You should contact the partner for the most up to date and correct pricing information. We do not take any responsibility for this pricing information, which is provided by our partners. Pricing last updated: 30 Jan, 2026 12:00AM
Testimonials
We used the AI to select 5 analytics from CI Hub to help us target donors for a quick, unscheduled end-of-year appeal. The response we got covered the annual cost of CI Hub for the next 10+ years.
Chelsea J
Senior Director of Advancement Services
